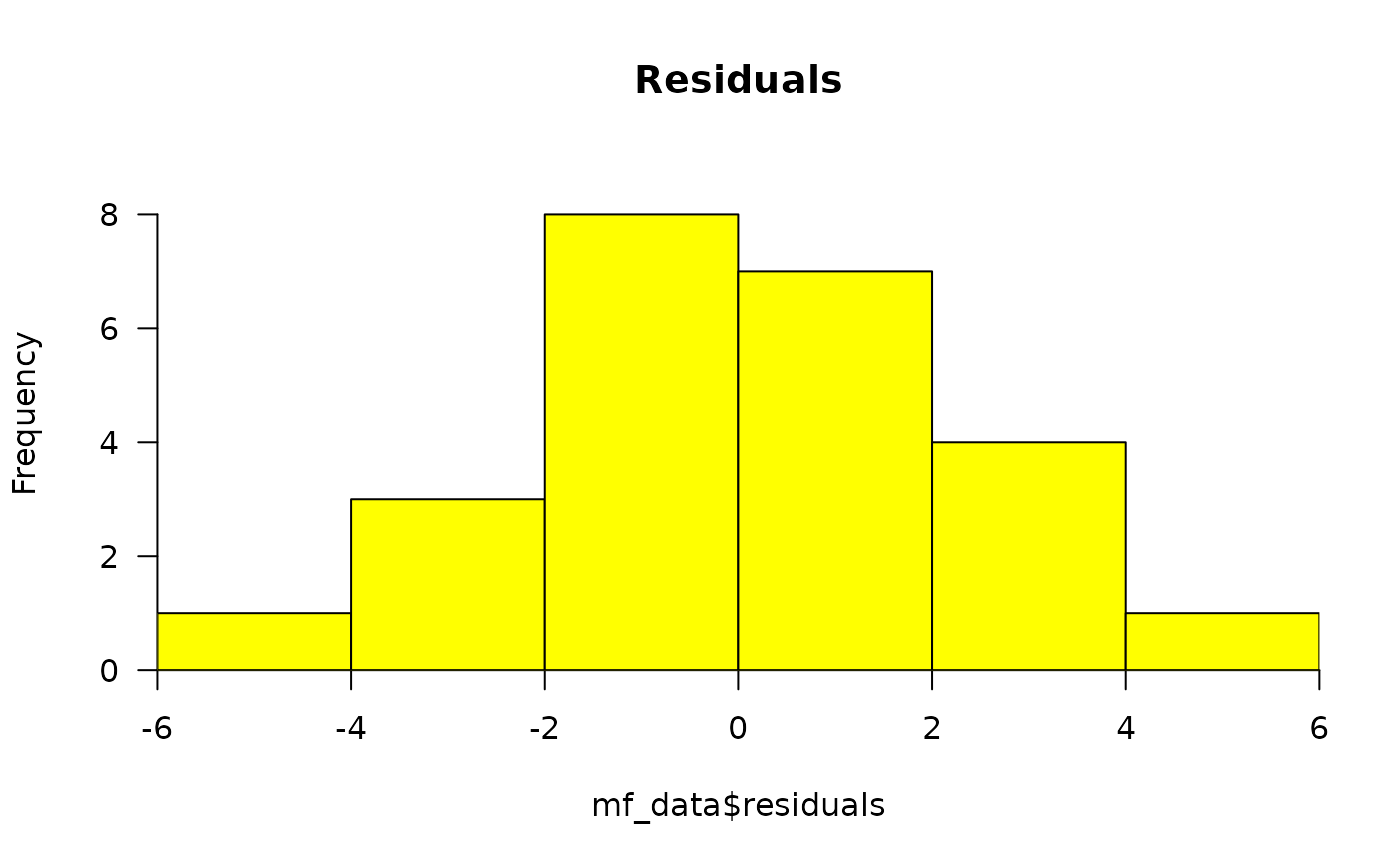
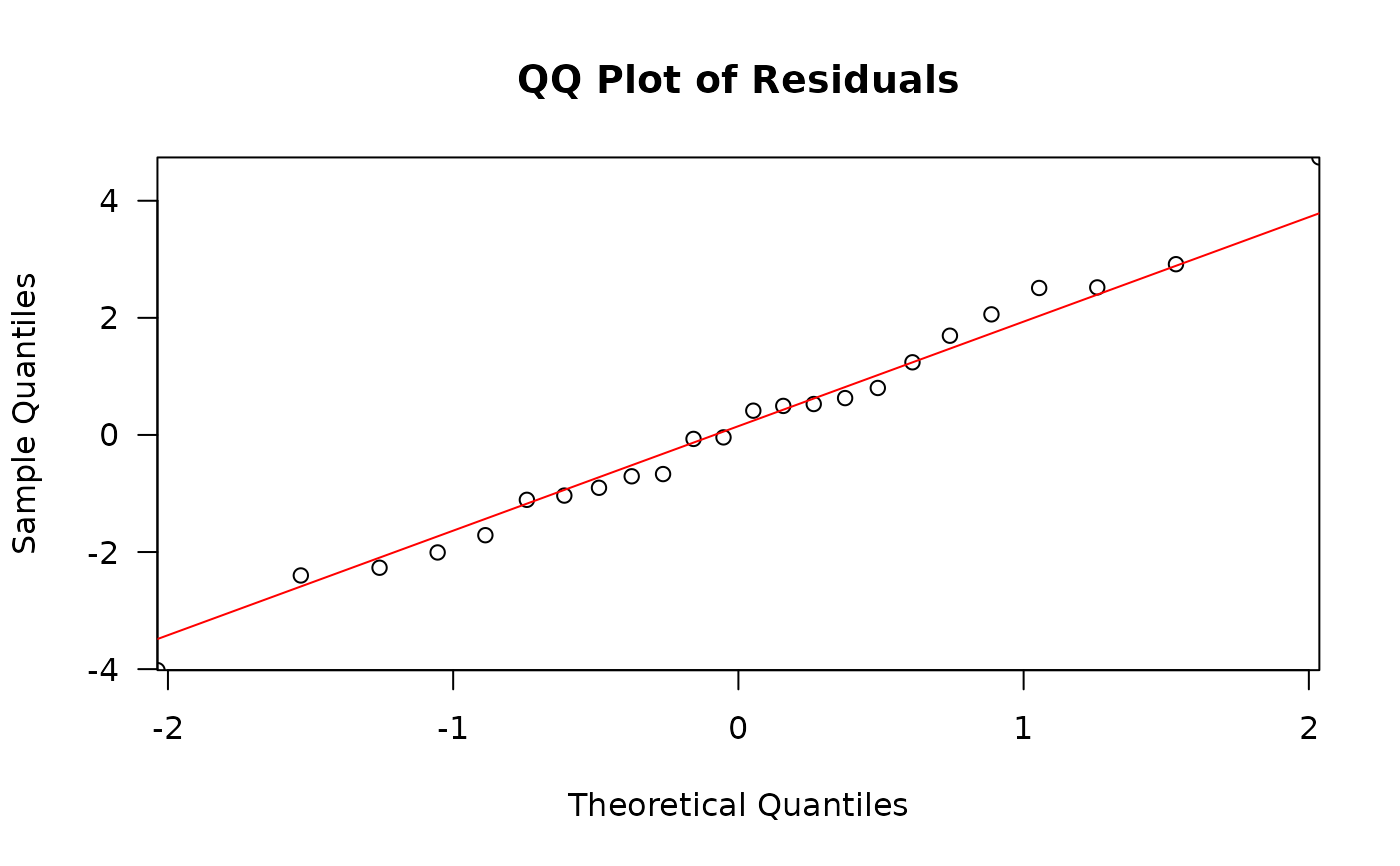
Provide a visualization of the point estimates derived using model_mf()
Usage
plot_model_mf(
  model,
  plot_type = "point",
  x_effect = NULL,
  plot_error_bars = TRUE,
  plot_signif = TRUE,
  ref_effect = NULL,
  x_order = NULL,
  fill_order = NULL,
  x_label = NULL,
  y_label = NULL,
  plot_title = NULL,
  fill_label = NULL,
  custom_palette = NULL
)
Arguments
- model
A model object created using model_mf()
- plot_type
The type of plot to create. Options are "bar" or "point".
- x_effect
If there are multiple fixed effects in the model, specify the fixed effect to plot on the x-axis. The other will be used in the fill aesthetic. Currently, only 2 fixed effects are supported.
- plot_error_bars
Logical. If TRUE, the estimated standard error will be added to the plot.
- plot_signif
Logical. If TRUE, will add significance labels based on the pairwise_comparisons data frame in the model object. This is only valid if you supplied a contrasts table to model_mf(). Symbols will be applied to plotted values that are significantly different from the reference. Your contrasts table is structured as a data frame with two columns, each containing levels of the fixed effects to be contrasted. When adding significance labels, symbols will be added to the values defined in the first column, while the second column will represent the reference. A different symbol will be used for each unique reference level. If a single plotted value has been contrasted against multiple references, then it will gain multiple symbols for each significance difference.
- ref_effect
The fixed effect to use as the reference level when adding significance labels. Only applicable if using two fixed effects.
- x_order
A character vector indicating the order of the levels for the x_effect.
- fill_order
A character vector indicating the order of the levels for the fill aesthetic, if applicable.
- x_label
The label for the x-axis.
- y_label
The label for the y-axis.
- plot_title
The title of the plot.
- fill_label
The label for the fill aesthetic, if applicable.
- custom_palette
A vector of colors to use for the fill and color aesthetics. If not provided, a default palette will be used. When plotting a model that has a single fixed effect, you can specify colors for "fill" and "color" using a named vector. Likewise, when plotting a model with two fixed effects, you can specify colors for the levels within your fill variable.
Examples
# Example data consists of 24 mouse bone marrow DNA samples imported
# using import_mut_data() and filtered with filter_mut.
# Data was summarized per sample using calculate_mf() (see relevant
# examples). We will run the model with model_mf then plot the results.
mf_example <- readRDS(system.file("extdata/Example_files/mf_data_global.rds",
  package = "MutSeqR"
))
# We will compare all treated groups to the control group
contrasts <- data.frame(
  col1 = c("12.5", "25", "50"),
  col2 = c("0", "0", "0")
)
# Fit the model
model <- model_mf(
  mf_data = mf_example,
  fixed_effects = "dose",
  reference_level = "0",
  muts = "sum_min",
  total_count = "group_depth",
  contrasts = contrasts
)
#> Reference level for factordose:0
#> Fitting generalized linear model. glm(cbind( sum_min , group_depth ) ~  dose, family = quasibinomial
#> The highest residual in absolute value is:4.73969242941171in row:14


# Plot the results using plot_model_mf()
plot <- plot_model_mf(model,
  plot_type = "bar",
  x_effect = "dose",
  plot_error_bars = TRUE,
  plot_signif = TRUE,
  x_order = c("0", "12.5", "25", "50"),
  x_label = "Dose (mg/kg-bw/d)",
  y_label = "Estimated Mean MF (mutations/bp)",
  plot_title = ""
)
#> Joining with `by = join_by(dose)`
